Not really.
In the words of Seth Klarman the legendary deep value Boston based hedge fund manager (of Baupost):
“Never stop reading. History doesn’t repeat, but it does rhyme.”
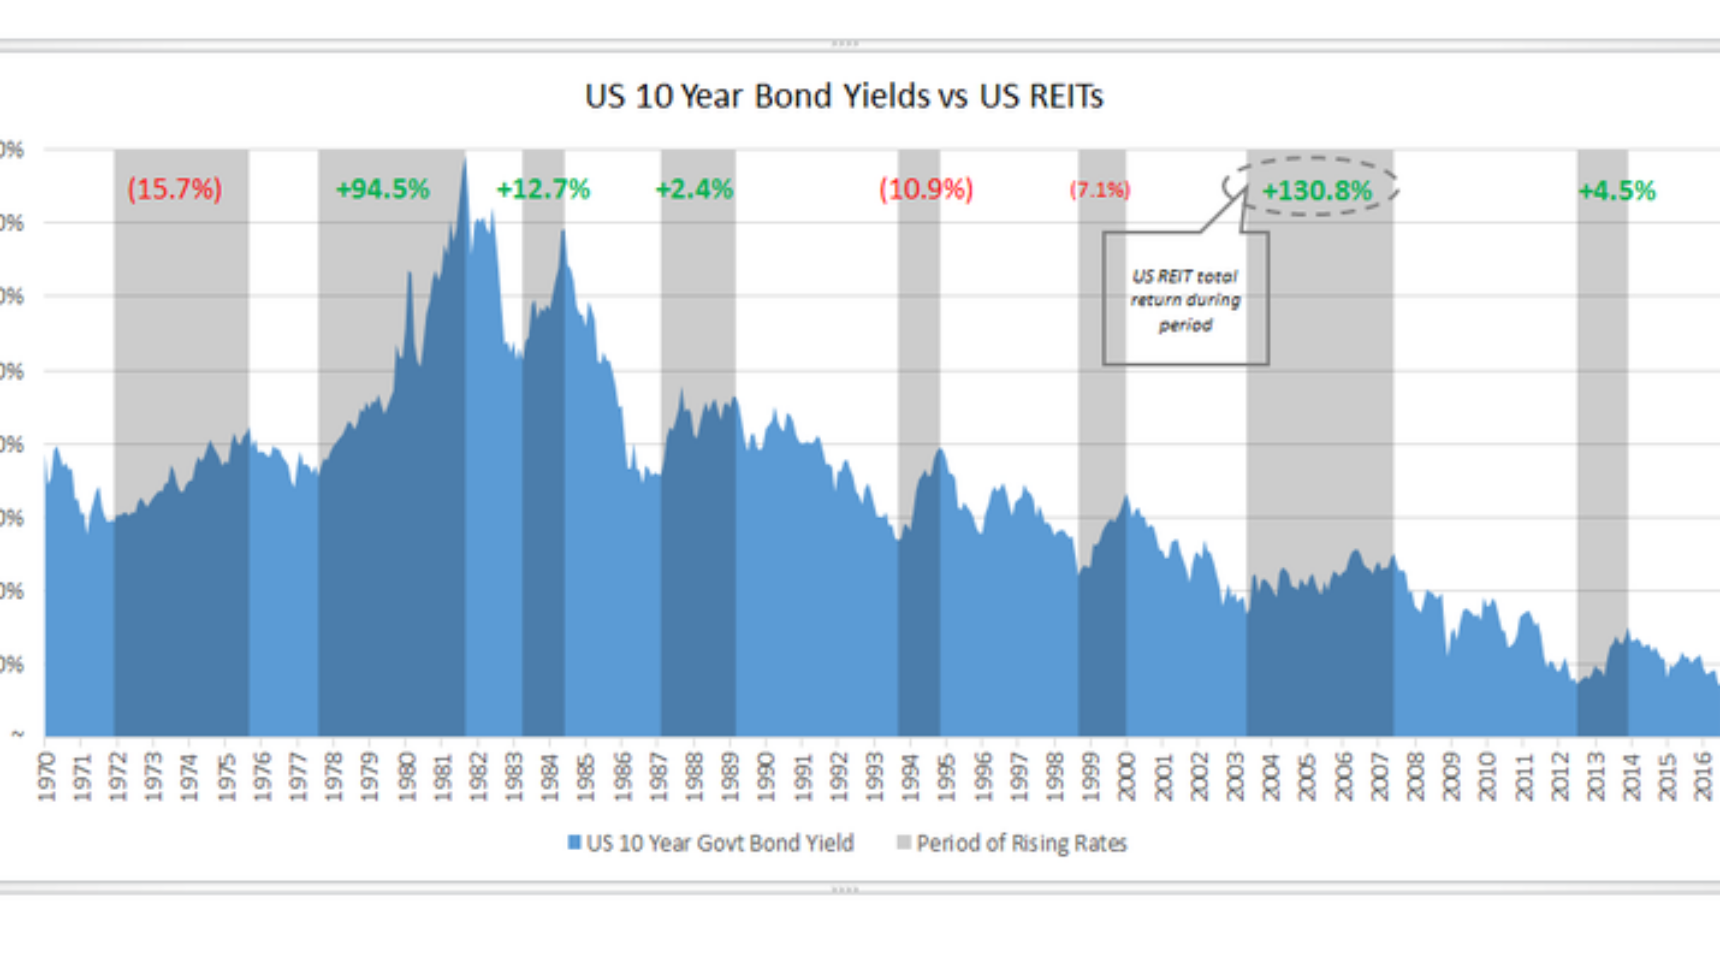
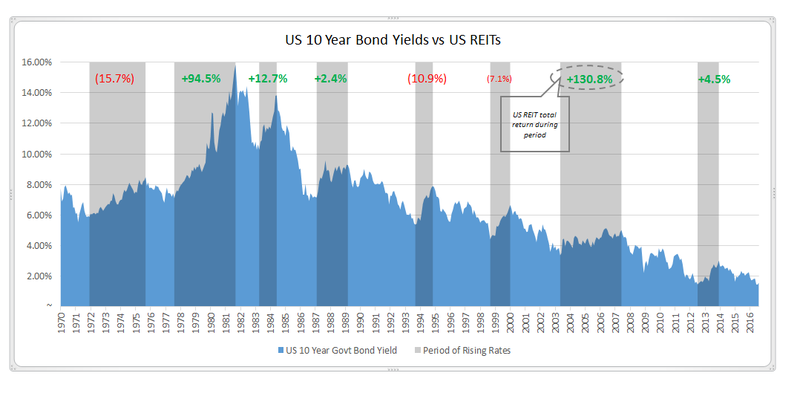
The relevance of the above quote is that over the last 9 periods of multi-quarter (or multi-year in some cases) interest rate rises since 1970, US REITs (as a proxy for REITs everywhere) have risen in 5 of those periods (the majority) for an average total return (including dividends or distributions) of 49%, and they’ve fallen 4 of those times for an average negative return of 10%.
Chart 1: US REIT Returns in rising real estate environments since the ‘70s
But this time is a new paradigm. Oh wait…… no it’s not………. it never is. When I was at BT in the early 2000’s we had a ‘New Paradigm’ Award – you didn’t want to win that award trust me, and I’m not trying to win it today.
Don’t get me wrong, real estate can go down like any other tradeable asset – but that correctional event usually comes at the end of an interest rate tightening cycle, which can last up to 5 years, and most typically on the back of euphoric economic conditions, plentiful credit and willingness of management teams to use this credit availability. I’d say we are a fair way from those conditions and that event; possibly years away.
You can create all the models in the world to tell you where interest rates are going to go over 5 to 10 years, but everyone who builds and monitors those models will tell you that they’ve got about as much predictive power as predicting the timing and severity of flu outbreaks. There are too many variables and at the end of the day humans are making the rate decisions.
You may say “So you’re telling me that real estate goes up when interest rates go down, when interest rates stay flat, and when interest rates go up”. To which I say “History would say in aggregate, yes”. “Buy land, they’re not making it anymore” – Mark Twain.
However let’s work off the common consensus that when interest rates go up, it’s bad (to use a Trumpism), and property will go down – the simple 1 to 1 correlation argument. If that be the premise then let’s look back at history’s periods of sustained rising interest rate environments since 1970 and see where the parallels are to today, in terms of the environment that set us up for sustained rising rates. I use the United States for illustrative purposes.
Dec ’71 – Sept ’75 – almost 4 years of tightening. Inflation was rampant….and I mean rampant.
In February 1968 inflation topped 4% for the first time since the Korean War in the early 50’s. In ’69 inflation was lighting up at 5.7% per annum – but things were only just getting started. In ’73 inflation was 8.7% – its highest level since 1941. Then when President Gerald Ford got in it got even better, with inflation sitting at 10.9%!
Same set up today? Aaah, not really. Janet Yellen is currently scurrying around Washington trying to work out how she’s going to sell in interest rate rises when inflation in the States trickled in at 1.4% per annum the other day.
Aug ’77 – Sept ’81 – a little more than 4 years of tightening. Did we suddenly move to Venezuela?
Oh, would you look at that. Inflation was 15%. There was massive over-regulation and subsequent bottlenecks in the system, which were unable to deal with the second oil price shock. Price controls were being implemented.
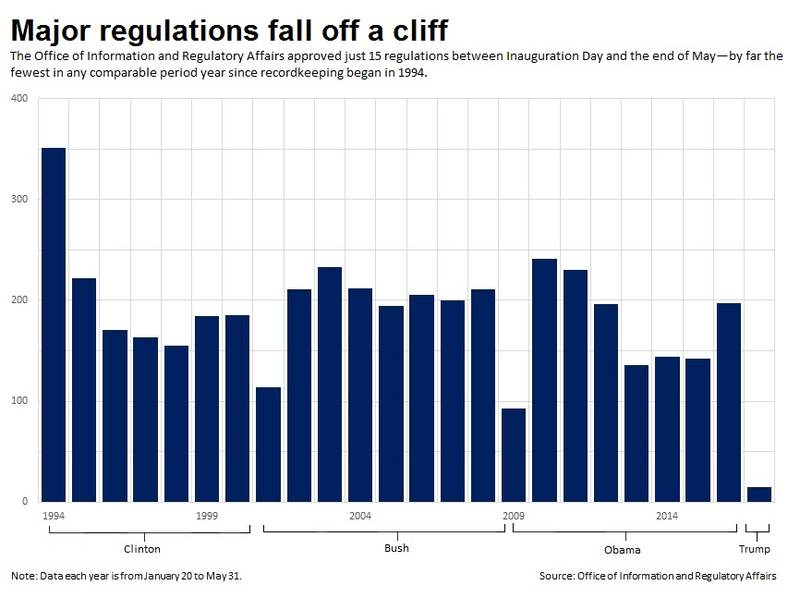
Same set up today? Aaah, not really. It’s never been easier to outsource, freelancing is keeping wage growth and inflation low and simple aggregators like Uber and Airbnb are utilising capacity in the system. Trump may be ineffective but he’s certainly shown no ambition to mark his success by regulations passed! Regardless REITs showed total return of almost 100% during this tightening 4 years.
Chart 2: Regulatory environment under Trump
Apr ’83 – Jun ’84 – just over a year of tightening. Economy was recovering after ’82 recession.
Inflation had been quashed by short term interest rates that hit 20% (yes 20%) in the back end of ‘81. Inflation had fallen from 15% in 1980 to 3.8% in ’83. The recession of ‘82 had passed, the economy was recovering and real GDP growth in the US hit 8.6% in ’84.
Same set up as today? Partially at best, however when you look at the numbers, GDP growth then was 8.6% versus between 2 and 3% today and inflation was 3.8% versus 1.4% today. Regardless REITs showed a total return of 12.7% over this year of tightening.
Feb ’87 – Mar ’89 – 2 years of tightening. Reagan wants inflation to go to zero!
Of course Greenspan doesn’t listen to Reagan because no-one really wants inflation at zero. However inflation was ticking back up strongly, from a level of 1.1% in Dec ’86 to 4.3% in Aug ’87. Greenspan starts raising rates to ward off inflation. The Dow Jones rose 44% in the 7 months to August ’87 – then the crash came in October ’87. Stock market correction didn’t do much to the economy (admittedly the finance sector was smaller and less interconnected then), and at the start of ’88 the US economy had seen its 23rd consecutive quarter of expansion; which for landlords means rent was still being paid. The correction in property didn’t come for another five years after when they started raising rates in ’87.
Same set up as today? Yes, similar, but again REITs rose in total return over this period and the correction in property prices didn’t come for 5 years after they started raising rates.
Sept ’93 – Nov ’94 – a little over a year of tightening. The recovery from the recession.
GDP growth was at 4.3%, inflation was 2.7%. REITs returns are negative by a small amount (-10.9%) during the period but this was more driven by the hangover of the massive oversupply that occurred in the lead up to the early 90’s.
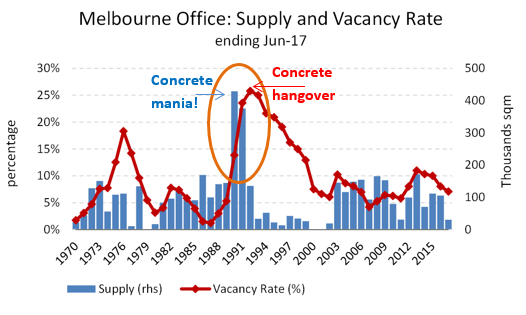
Same set up today? No. Growth today might get to 3% for the 2017 year and inflation is 1.4%. On the oversupply part, let’s use Melbourne as an example in the chart below. Vacancy was 26% in ‘92 due to massive building in 1990 and 1991. The supply put on in just those two years represented a whopping 29% of existing stock. Vacancy today in Melbourne is around 7% – a very different and more disciplined story.
Chart 3: Building boom coming into the ’90/’91 recession
Sept ’98 – Jan ’00 – over a year of tightening. Tech booming, no earnings from tech, GDP growth at 7.1%.
Stock market was booming, mostly in technology related companies. Market interest rates were rising in anticipation of Y2K. GDP growth was at 5.0% in first quarter of ’99.
Same set up today? No. I wouldn’t say the stock market has been booming like it was in ’87 or in ‘99. These days, technology companies are the most earnings generative businesses out there. Growth today is at 3% or below.
May ’03 – Jun ’07 – 4 years of tightening. Swimming along, swimming along, debt building.
Let’s face it things were pretty good. In the fourth quarter of 2003 growth in the US was at 4.4% and inflation was declining. In June ’04 house prices had risen by 20% over the whole of the US in a year (that growth in one year represented the same as an entire 10 years before).
Same set up as today? Yes, but interest rates rose for 4 years from when they started rising in mid-2003, in which time house prices continued to go up and REITs showed a total return of 130% (or a simple average of over 32% per annum) over these four years. In addition to this, today we are not at extreme and toxically stratified debt levels that were financing real assets in 2007 (there is some further commentary on this in the last paragraph).
July ’12 – Dec ’13 – 1 and a half years of market interest rate rises. Remember the great bond crash of ’13?
Me neither – ‘nough said. REITs showed total return of 4.5%, which still represented 3x inflation for what it’s worth.
July ’16 – Jan ’17 – half a year. That other great bond crash!
Market rates went up a little, REITS went down a little (-7%), however rents and thus distributions are still being paid on time.
A thought on inflation
How many times have you heard statistics about how many workers will be free agents in the future, and your children will have to create their own jobs. This sounds interesting, exciting and scary, but the reality is that it doesn’t do much for inflation or wage growth, because everything becomes so fluid, and water will run downhill into any crevice it can find. This means that the when the whole world has been pushed into competition for tasks, people will compete hard, and will usually compromise on price.
The takeaways from all of the above are: 1) Inflation is what has historically driven rates up (Ok many will say ‘no da’), 2) It’s a myth that’s there’s this infallible causation and effect between interest rates and real estate returns, and 3) Real estate has historically been a fantastic hedge against inflation, as we get to capture inflation and more in our leases.
While it’s always lauded to bring ideas and concepts down to very small bite sized parcels, like “rates go up, defensives go down”, there is a lot more to real estate investment than the discount rate or the cap rate, and interest rates bearing on those. The reality is that rental and occupancy cost trajectories in grocery anchored shopping centres in Poland are vastly different from office rents and hotel vacancies in Beijing which are vastly different from long lease office tenants on the East coast of the United States. There are around 5,500 real estate related stocks listed on markets around the globe – that’s a big universe and there’s always value to be had in various pockets of sectors and geographies.
On a closing note I wanted to highlight the way we do business/ investment in relation to gearing and the importance of choosing stocks with relatively low levels of gearing.This is a key part of our analysis and selection process and is quiet intricate because not only does the debt have to be correctly identified and classified by sifting through Balance Sheets but the asset base must also be correctly valued (which under different accounting standards is harder than you think). We’ve done significant back testing on this factor and the results we’ve found are telling and a little paradoxial. Even in periods when debt is cheap or getting cheaper, those stocks with moderate gearing perform better than the average or the market. You would expect than in lowering debt costs/ interest rate environments that the more geared stocks would do better, but that’s not the case and the number one thing that this points to is superior management of the REIT or company. This superior management is key to selecting the right REITs from the universe I talked about above, particularly when you have a deep value strategy like we do.
Since opening to outside investors in May of 2017 The Fortius Global Property Fund has risen 2.6% to the end of August 2017, versus a (-2.6%) return for its benchmark, 520 bps of value added over this period.